
Why East Suffolk MUST go into lockdown
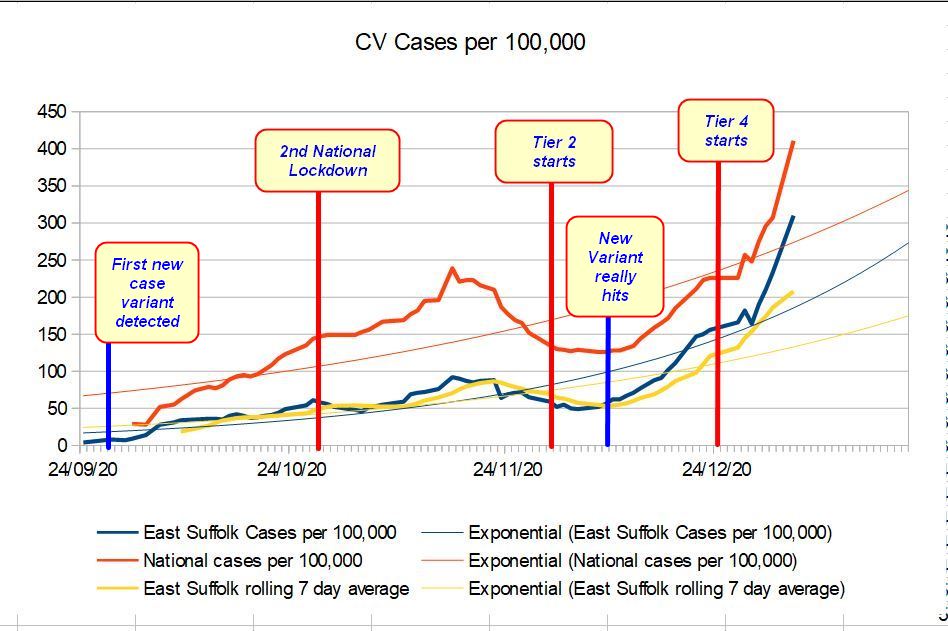
This graph shows why we in East Suffolk need to go into full lockdown, and should perhaps have done so earlier. September, local cases were pretty low. Encouraging, even. Then they started to go up, mirroring but still lower than the national climb. By October it was a strong upward trend. Eventually, the government put us into the second national Lockdown-With-Many-Exceptions. From the graph, it certainly seems that this had some effect, and by December the figures were around where we had started the lockdown. East Suffolk was put into Tier 2, because our overall infection rate was still, relative to the national rate, low. But it's clear from the chart that Tier 2 slowed the rate but didn't reduce it. It seems likely that by now the new variant was spreading fast. The variant's higher level of infectiousness becomes even more obvious from mid-December. The growth rate was sharper, and from Christmas onward, steep. The measures were no longer sufficient to control the rate of infection and accompanying illness. So now we have to lockdown. Whatever other effect this has, it will pale into insignificance if the NHS and all the huge numbers of support services become overwhelmed, not to mention the knock-on effect of thousands, millions, being unable to work because they are infected or ill. It seems to me we have only one option. Full shutdown for at least four weeks. And try to ramp up the vaccination programme. I can't see much point in trying to operate Track and Trace - there's just too many getting infected, though some effort should be made to be ready to implement it as the vaccination begins to have effect. All we can do is keep going. Calmly. I used data from the BBC's 'Infections in your area' , recorded and charted in Open Office's Calc programme. JE
Add new comment