
archive
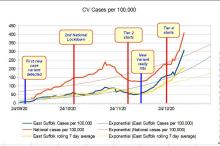
This graph shows why we in East Suffolk need to go into full lockdown, and should perhaps have done so earlier. September, local cases were pretty low. Encouraging, even. Then they started to go up, mirroring but still lower than the national climb. By October it was a strong upward trend. Eventually, the government put us into the second national Lockdown-With-Many-Exceptions. From the graph, it certainly seems that this had some effect, and by December the figures were around where we had started the lockdown.
Added: 23 September, 2023